

Highlights
In July, the preliminary number of international arrivals to Canada by air and automobile increased 6.5% from July 2023.
By air, the number of non-resident arrivals in Canada totalled 1.4 million in July 2024, up 7.9% year over year. Meanwhile, the number of Canadian-resident return trips from abroad by air reached 1.5 million, an 11.6% increase from July 2023.
By automobile, US residents took 1.9 million trips to Canada in July 2024, up 5.5% from the same month in 2023. The number of Canadian-resident return trips by automobile also rose, up 3.7% year over year to reach 2.7 million trips in July 2024.
All statistics in this release are based on the primary data sources for air and automobile arrivals (see Note to readers). To further explore current and historical data in an interactive format, please visit the Frontier Counts: Interactive Dashboard.
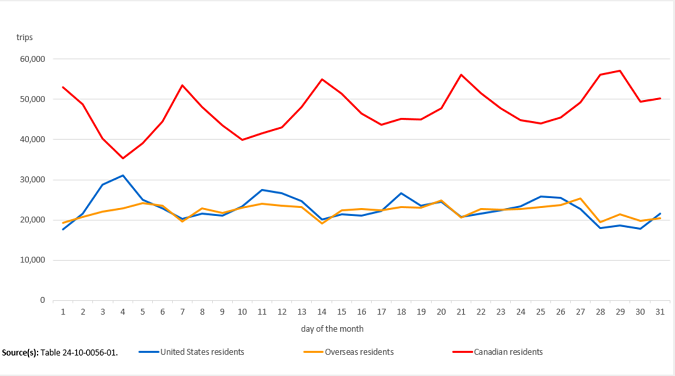
Trips to Canada by commercial aircraft, by country of residence, July 2024
Description - Trips to Canada by commercial aircraft, by country of residence, July 2024
The title of the infographic is "Trips to Canada by commercial aircraft, by country of residence, July 2024"
This is a line chart.
The vertical axis shows the number of trips, from 0 to 60,000, by increments of 10,000.
The horizontal axis shows the days from July 1 to 31, by increments of one day.
There are three series in this chart.
The first series is United States residents. The lowest point in this line is 17,609 on July 1, and the highest point in this line is 31,107 on July 4.
The second series is Overseas residents. The lowest point in this line is 19,157 on July 14, and the highest point in this line is 25,374 on July 27.
The third series is Canadian residents. The lowest point in this line is 35,334 on July 4, and the highest point in this line is 57,159 on July 29.
Source(s): Table 24-10-0056-01.
Non-resident trips to Canada by air
In July, non-resident arrivals in Canada by air totalled 1.4 million, up 7.9% year over year. These include arrivals by US residents (709,900) and residents of countries other than the United States (690,700). On Independence Day—a federal holiday in the United States celebrated on Thursday, July 4—31,100 US residents arrived in Canada by air, the highest daily total of US-resident arrivals during the month. This number surpassed the daily average of the remaining Thursdays in July (26,600) by 16.7%.
When data from Toronto Pearson International Airport Terminal 1 are excluded from the total arrivals (see Note to readers), non-resident arrivals in July were 2.5% higher than the pre-COVID-19 pandemic level observed in July 2019.
Canadian-resident return trips by air
In July, Canadian-resident return trips by air stood at 1.5 million, up 11.6% from the same month one year earlier. Conversely to US-resident arrivals in Canada, on July 4, Independence Day, Canadian residents made the fewest return trips by air of any day in July (35,300). This number was 18.8% lower than the average of the remaining Thursdays in July (43,500). The highest daily average of Canadian-resident arrivals by air was observed on Sundays (55,200), although Monday, July 29 (57,200), had the most arrivals of any day in the month. The lowest daily average was on Thursdays (41,500).
When arrivals at Toronto Pearson International Airport Terminal 1 are excluded from the total arrivals (see Note to readers), the number of return trips in July was 17.6% higher than the 928,500 trips recorded in July 2019, before the pandemic.
US-resident trips to Canada by automobile
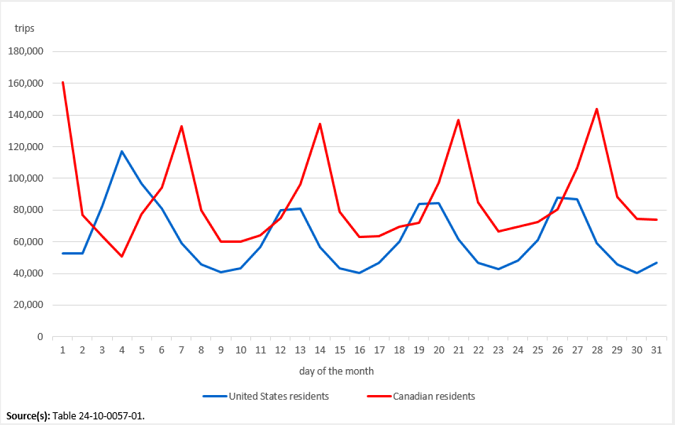
In July, the number of US-resident trips to Canada by automobile reached 1.9 million, up 5.5% from the 1.8 million trips recorded in the same month in 2023. In July 2024, the date with the most US-resident trips to Canada by automobile was July 4 (117,000), Independence Day, and the highest daily average of US-resident trips to Canada was observed on Fridays (87,100), while the lowest daily average was on Tuesdays (43,300).
The total number of US-resident arrivals in Canada by automobile in July represented 87.8% of that observed in July 2019.
Trips to Canada by automobile, by country of residence, July 2024
Description - Trips to Canada by automobile, by country of residence, July 2024
The title of the infographic is "Trips to Canada by automobile, by country of residence, July 2024"
This is a line chart.
The vertical axis shows the number of trips, from 0 to 180,000, by increments of 20,000.
The horizontal axis shows the days from July 1 to 31, by increments of one day.
There are two series in this chart.
The first series is United States residents. The lowest point in this line is 40,125 on July 16, and the highest point in this line is 116,964 on July 4.
The second series is Canadian residents. The lowest point in this line is 50,602 on July 4, and the highest point in this line is 160,542 on July 1.
Source(s): Table 24-10-0057-01.
Canadian-resident return trips by automobile
In July, the number of Canadian-resident return trips from visits to the United States by automobile totalled 2.7 million, an increase of 3.7% compared with the same month one year earlier. On July 1, Canada Day, Canadian residents took the most return trips from the United States by automobile (160,500) during the month. This number was 93.4% higher than the average of the remaining Mondays in July (83,000). The highest daily average of Canadian-resident return trips was observed on Sundays (136,900), while the lowest daily average was on Thursdays (64,000).
In July, the number of Canadian-resident return trips by automobile reached 90.0% of the 3.0 million trips observed in the same month in 2019.

StatsCAN app
Download the StatsCAN app today to have these articles at your fingertips! Already using the app? Leave a review in the App Store and Google Play and let us know what you think.
Note to readers
This release provides an early indicator of travel based on preliminary data on international arrivals to Canada in July 2024. Complete counts for the July reference month will be available with the release of "Travel between Canada and other countries" on September 23, 2024.
In July 2024, updates were made to some country names to align with the tourism variant of the 2022 Standard Classification of Countries and Areas of Interest.
All counts of arrivals by air are from commercial aircraft and are produced exclusively using Primary Inspection Kiosk (PIK) data received from the Canada Border Services Agency (CBSA). PIKs were deployed at Toronto Pearson International Airport Terminal 1 on June 22, 2021, and, as of July 2021, these arrivals are included in the total counts, which has consequently improved coverage. In 2023, PIKs captured 91.2% of all commercial air arrivals.
Counts of arrivals entering the country by automobile through land ports equipped with the CBSA's automated Integrated Primary Inspection Line (IPIL) system represent a subset of US-resident trips and Canadian-resident return trips by automobile. In 2023, IPIL land ports captured 89.1% of all automobile entries.
Readers are encouraged to review the concepts, definitions, data sources, and methods for Frontier Counts, especially when making historical comparisons and examining specific regions.
Select estimates from the Canadian Tourism Activity Tracker for May 2024 are available upon request.
Products
The product "Frontier Counts: Interactive Dashboard," part of the Data Visualization Products series (71-607-X), is available.
Contact information
For more information, or to enquire about the concepts, methods or data quality of this release, contact us (toll-free 1-800-263-1136; 514-283-8300; infostats@statcan.gc.ca) or Media Relations (statcan.mediahotline-ligneinfomedias.statcan@statcan.gc.ca).