

National net worth rises due to strong energy and house price growth
National net worth, the sum of national wealth and Canada's net foreign asset position, rose 2.6% in the first quarter to $17,590.6 billion, expanding at a relatively slower pace following a string of stronger growth over the previous six quarters and notably slower than the rise of 6.8% in the fourth quarter of 2021. Continued strength in real estate and higher natural resources wealth was hampered in the first quarter of 2022 by a reversal of fortunes in Canada's net foreign asset position, which ended sharply lower after growing for seven consecutive quarters. National net worth per capita reached $455,573 in the first quarter.
The total value of non-financial assets in Canada, also referred to as national wealth, rose 5.1% to $16,440.6 billion. The value of residential real estate increased $344.0 billion to $9,101.9 billion in the first quarter, as the appreciation in home prices continued. Global supply chain disruptions and sanctions resulting from Russia's invasion of Ukraine placed upward pressure on global energy and mineral prices, as the value of natural resources (excluding land) increased 20.9% from the fourth quarter of 2021 to reach $1,781.5 billion.
Canada's net foreign asset position, the difference between Canada's international financial assets and international liabilities, plummeted $352.6 billion to $1,150.0 billion by the end of the first quarter, its lowest level since the third quarter of 2020. The revaluation effect resulting from market price changes (-$248.1 billion), notably equity prices, was the primary contributor to the decline.
Highlights
The Canadian economy expanded at a slower pace in the first quarter amidst regional restrictions due to the rapid spread of the Omicron variant of COVID-19. Growth in real gross domestic product was mainly driven by increased business investment and household consumption, particularly investment in residential construction and outlays for durable goods respectively.
On a nominal basis, compensation of employees recorded strong gains, mainly due to increases in average wages, which were almost double the rate of growth for employment. Wage growth was broad-based in terms of industry and region, and was the main contributor to the rise in nominal household disposable income and subsequent rise in the savings rate in the first quarter. On a seasonally adjusted basis, mortgage borrowing by households was the third highest on record, as home resale prices increased amidst the start of the Bank of Canada's rate-hiking cycle, which began in March.
The federal government continued to borrow through the issuance of long-term debt, albeit at a slower pace, while the Bank of Canada began to reduce the size of its balance sheet. With the first policy rate hike since 2018, bond prices tumbled during the first quarter on expectations of further interest rate increases. Widespread declines in the valuation of technology companies combined with higher valued natural resource companies led to divergent returns among owners of domestic and foreign securities.
Household savings rate moves higher as wages grow
In the first quarter, seasonally adjusted household consumption rose by 2.4% in nominal terms against the backdrop of a surge in cases of the Omicron variant. Despite households facing rising prices on their purchases, growth in disposable income more than kept pace, growing by 3.3% in the first quarter, resulting in a savings rate of 8.1%. This compares to a 6.9% savings rate in the fourth quarter of 2021 and, outside of the elevated savings during the COVID-19 pandemic years of 2020 and 2021, still denotes the highest savings rate since the fourth quarter of 1995.
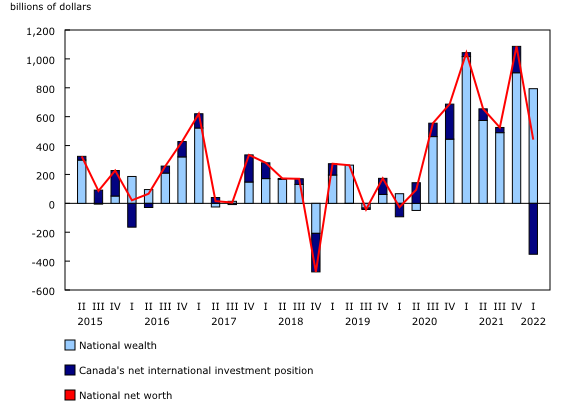
Description - Chart 1 Change in national net worth by component
Change in national net worth by component, billions of dollars
| National wealth | Canada's net international investment position | National net worth | |
|---|---|---|---|
| Second quarter 2015 | 299.5 | 25.9 | 325.4 |
| Third quarter 2015 | -5.5 | 91.5 | 86.0 |
Pace of household mutual fund investment remains elevated
Household net savings represent a source of funds that are available to increase non-financial and financial wealth through transactions, that is, the purchase of assets and settlement of liabilities. After accumulating $314.5 billion in currency and deposits over the preceding two years, households recorded a more modest addition of $19.5 billion in the first quarter of 2022. Among chartered banks, households held their funds primarily in personal demand and notice deposits, such as chequing and savings accounts, rather than fixed-term deposits, which are generally more illiquid. With the recent interest rate increase, fixed-term deposits such as guaranteed investment certificates (GICs), may be seen as a more rewarding investment in the near future.
Households continued to purchase mutual funds at a significant pace in the first quarter amid registered retirement savings plan (RRSP) contribution season, adding $20.2 billion in fund shares as gross purchases exceeded redemptions by a relatively wide margin, continuing the trend of strong investment in this asset category since the end of 2020.
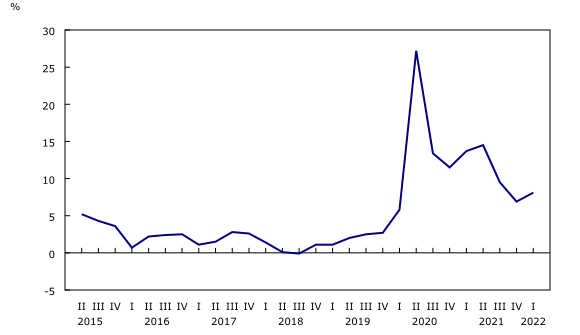
Description - Chart 2 Household savings rate, seasonally adjusted
Ex.
Households' net worth reaches new high in the face of challenging market conditions
Household sector net worth—the value of all assets minus all liabilities—increased $194.7 billion to $16,191.7 billion in the first quarter. Financial liabilities grew by $35.0 billion (+1.3%) during the quarter, mainly due to the continued expansion of outstanding mortgage debt, while the value of financial assets decreased for the first time since the first quarter of 2020 when markets were roiled by the initial uncertainty regarding the pandemic. However, the growth in the value of non-financial assets more than compensated for the increased liabilities and declining financial assets, rising by $326.4 billion (+3.5%) to reach nearly $9.6 trillion in the first quarter of 2022.
Note to readers
Revisions
This release of the national balance sheet and financial flow accounts for the first quarter of 2022 includes revised estimates from the first quarter to the fourth quarter of 2021. These data incorporate new and revised data, as well as updated data on seasonal trends. An overview of the conceptual, methodological and statistical revisions incorporated as of the release for the third quarter of 2021 is available in "An overview of revisions to the Financial and Wealth Accounts, 1990 to 2021."
Data enhancements to the national balance sheet and financial flow accounts, such as the development of detailed counterparty information by sector, will be incorporated on an ongoing basis. To facilitate this initiative and others, it is necessary to extend the annual revision period (normally the previous three years) at the time of the third quarter release. Consequently, for the next two years, with the third quarter release of the financial and wealth accounts, data will be revised back to 1990 to ensure a continuous time series.
Financial and wealth accounts on a from-whom-to-whom basis: Selected financial instruments
The data visualization product "Financial accounts on a from-whom-to-whom basis, selected financial instruments" has been updated with data from the first quarter of 2021 to the first quarter of 2022.
Next release
Data on the national balance sheet and financial flow accounts for the second quarter of 2022 will be released on September 12, 2022.
Overview of the financial and wealth accounts
This release of the financial and wealth accounts comprises the National Balance Sheet Accounts (NBSA), the Financial Flow Accounts (FFA) and the other changes in assets account.
The NBSA are composed of the balance sheets of all sectors and subsectors of the economy. The main sectors are households, non-profit institutions serving households, financial corporations, non-financial corporations, government and non-residents. The NBSA cover all national non-financial assets and all financial asset-liability claims outstanding in all sectors. To improve the interpretability of financial flows data, selected household borrowing series are available on a seasonally adjusted basis (table 38-10-0238-01). All other data are unadjusted for seasonal variation. For information on seasonal adjustment, see Seasonally adjusted data – Frequently asked questions.
The FFA articulate net lending or borrowing activity by sector by measuring financial transactions in the economy. The FFA arrive at a measure of net financial investment, which is the difference between transactions in financial assets and liabilities (for example, net purchases of securities less net issuances of securities). The FFA also provide the link between financial and non-financial activity in the economy, which ties estimates of saving and non-financial capital acquisition (for example, investment in new housing) to the underlying financial transactions.
While the FFA record changes in financial assets and liabilities between opening and closing balance sheets that are associated with transactions during the accounting period, the value of assets and liabilities held by an institution can also change for other reasons. These other types of changes, referred to as other economic flows, are recorded in the other changes in assets account.
There are two main components to this account. One is the other changes in the volume of assets account. This account includes changes in non-financial and financial assets and liabilities relating to the economic appearance and disappearance of assets, the effects of external events such as wars or catastrophes on the value of assets, and changes in the classification and structure of assets. The other main component is the revaluation account, showing holding gains or losses accruing to the owners of non-financial and financial assets and liabilities during the accounting period as a result of changes in market price valuations.
At present, only the aggregate other change in assets is available within the Canadian System of Macroeconomic Accounts; no details are available on the different components.
Definitions concerning financial indicators can be found in "Financial indicators from the National Balance Sheet Accounts" and in the Canadian System of Macroeconomic Accounts glossary.
Distributions of household economic accounts
The NBSA for the household sector is allocated across a number of socioeconomic dimensions as part of the distributions of household economic accounts (DHEA). Data on wealth and its components by income quintile, age group, generation and region are available in tables 36-10-0585-01, 36-10-0586-01, 36-10-0589-01 and 36-10-0590-01.
The methodology for DHEA wealth estimates can be found in the article "Distributions of Household Economic Accounts, estimates of asset, liability and net worth distributions, 2010 to 2019: Technical methodology and quality report."
Products
The data visualization product "Financial accounts on a from-whom-to-whom basis, selected financial instruments," which is part of Statistics Canada – Data Visualization Products (Catalogue number71-607-X), is now available.
As a complement to this release, you can also consult the document "An overview of revisions to the Financial and Wealth Accounts, 1990 to 2021," which is part of Latest Developments in the Canadian Economic Accounts (Catalogue number13-605-X).
As a complement to this release, you can also consult the data visualization product "Distributions of Household Economic Accounts, Wealth: Interactive tool," which is part of Statistics Canada – Data Visualization Products (Catalogue number71-607-X).
As a complement to this release, you can also consult the data visualization product "Securities statistics," which is part of Statistics Canada – Data Visualization Products (Catalogue number71-607-X).
The Economic accounts statistics portal, accessible from the Subjects module of our website, features an up-to-date portrait of national and provincial economies and their structure.
The Latest Developments in the Canadian Economic Accounts (Catalogue number13-605-X) is available.
The User Guide: Canadian System of Macroeconomic Accounts (Catalogue number13-606-G) is available.
The Methodological Guide: Canadian System of Macroeconomic Accounts (Catalogue number13-607-X) is available.
The Special Data Dissemination Standard Plus product "Other Financial Corporations Survey," also known as "Assets and liabilities of other financial corporations by sector, market value, quarterly" (table 36-10-0668-01), is available.
Contact information
For more information, or to enquire about the concepts, methods or data quality of this release, contact us (toll-free 1-800-263-1136; 514-283-8300; infostats@statcan.gc.ca) or Media Relations (statcan.mediahotline-ligneinfomedias.statcan@statcan.gc.ca).