
Canadian farmers reported planting more wheat, oats, soybeans, lentils, corn, and dry peas, but fewer acres of canola and barley in 2025.
In general, warm and dry conditions across much of Western Canada were favourable for seeding. According to provincial reports, seeding progressed ahead of the 5- and 10-year averages for all three Prairie provinces, with the majority of seeding complete before the end of May. While dry conditions were generally good for seeding progress, a lack of rain remains an ongoing concern for producers across parts of the Prairies.
In Eastern Canada, temperatures were at or below normal early in the growing season, while precipitation was above average for much of Ontario and Quebec. Cool and wet conditions may have resulted in some seeding delays for some crops.


Farmers planting more wheat
Nationally, farmers reported planting 26.9 million acres of wheat in 2025, up 1.0% from 2024. Higher total wheat area was led by durum wheat, with area rising 2.6% to 6.5 million acres, while winter wheat area, grown predominantly in Eastern Canada, rose 18.2% to 1.6 million acres. Spring wheat area decreased 0.7% to 18.8 million acres.
In Saskatchewan, farmers reported planting 14.0 million acres of wheat in 2025, down 1.1% from 2024. Spring wheat area decreased 2.1% to 8.8 million acres, while durum wheat area rose 0.1% to 5.1 million acres.
Farmers in Alberta reported wheat area was up 3.2% to 8.1 million acres. The increase was driven by durum wheat area, which rose 11.6% to 1.3 million acres, while spring wheat area rose 0.8% to 6.5 million acres.
Manitoba producers reported that total wheat seeded area increased 1.9% to 3.3 million acres.
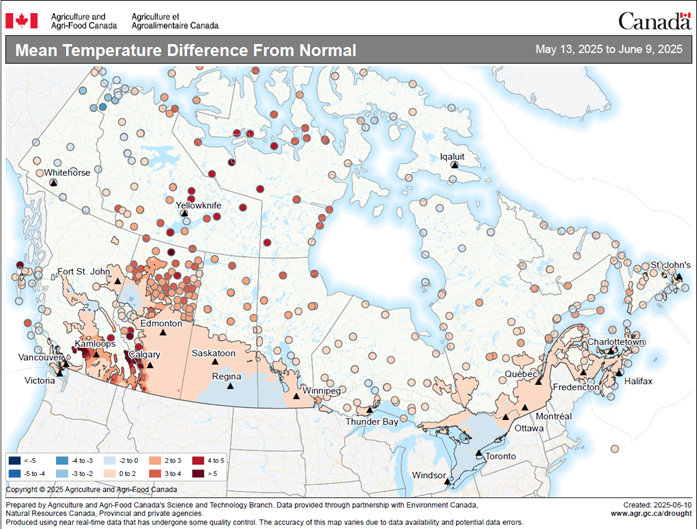
Description - Map 1 Mean temperature difference from normal (in degrees Celsius) from May 13 to June 9, 2025 (during the growing season), compared with annual average
Map description
The title of the map is "Mean temperature difference from normal (in degrees Celsius) from May 13 to June 9, 2025 (during the growing season), compared with annual average"
This map shows temperatures at or above normal in most of Western Canada, parts of Quebec and parts of Atlantic Canada. Temperatures were below normal in parts of southeastern Saskatchewan and southwestern Manitoba, most of Ontario and parts of Quebec.
Note(s): Prepared by Agriculture and Agri-Food Canada's Science and Technology Branch. Data provided through partnership with Environment Canada, Natural Resources Canada, provincial and private agencies. Produced using near real-time data that have undergone some quality control. The accuracy of this map varies due to data availability and potential data errors.
Source(s): Agriculture and Agri-Food Canada, Drought Watch and agroclimate.
Canola planting down in all three Prairie provinces
In 2025, farmers reported planting 21.5 million acres of canola, down 2.5% from the previous year, possibly caused by a combination of concerns including soil moisture and ongoing trade issues.
In Saskatchewan, where more than half of Canada's canola is grown, farmers reported planting 12.0 million acres of canola, down 0.5% from 2024.
In Alberta, respondents reported planting 6.2 million acres of canola in 2025, down 2.8% from the previous year, while in Manitoba, farmers reported seeding 3.0 million acres, down 9.2% from 2024.
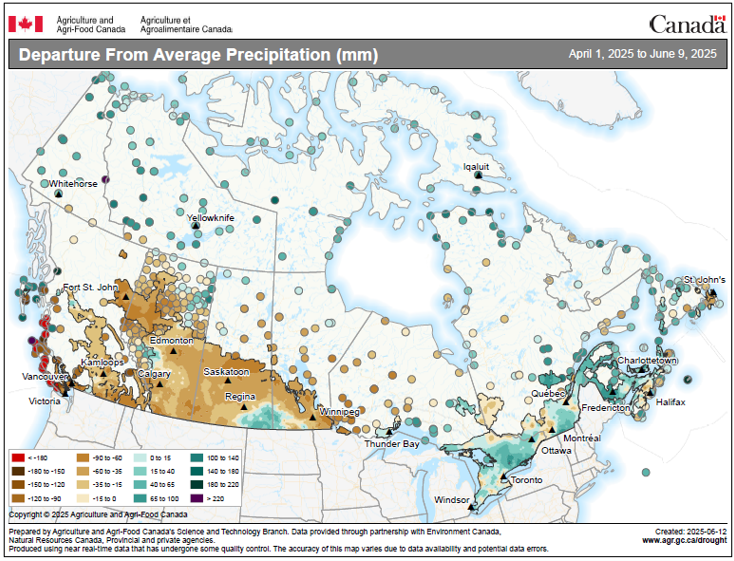
Description - Map 2 Departure from average precipitation (in millimetres) from April 1 to June 9, 2025 (during the growing season), compared with annual average
Map description
The title of the map is "Departure from average precipitation (in millimetres) from April 1 to June 9, 2025 (during the growing season), compared with annual average"
This map shows precipitation since the beginning of the growing season was at or below average in British Columbia, most of Alberta, Saskatchewan, Manitoba, southern Ontario and parts of the Atlantic provinces. Precipitation was above normal in parts of central Alberta, southeastern Saskatchewan, southwestern Manitoba, and much of Ontario, Quebec.
Note(s): Prepared by Agriculture and Agri-Food Canada's Science and Technology Branch. Data provided through partnership with Environment Canada, Natural Resources Canada, provincial and private agencies. Produced using near real-time data that have undergone some quality control. The accuracy of this map varies due to data availability and potential data errors.
Source(s): Agriculture and Agri-Food Canada, Drought Watch and agroclimate.
Record soybean seeding in Quebec
Nationally, soybean area rose 0.5% compared with the previous year to 5.7 million acres in 2025.
In Ontario, where the majority of the country's soybeans are grown, farmers reported planting 2.9 million acres of soybeans, down 7.4% from one year earlier, roughly in-line with the five-year average.
Farmers in Quebec reported seeding a record soybean area in 2025, up 4.4% from the previous year to 1.1 million acres.
In Manitoba, farmers reported planting 1.6 million acres of soybeans compared with 2024, up 13.0%.
Barley planting down, oats seeding up
Farmers reported planting 6.1 million acres of barley in 2025, a 4.2% decrease compared with the previous year. Lower barley area was led by Alberta, where producers reported seeding 3.3 million acres, down 5.7% from 2024. Barley area also decreased in Saskatchewan, falling 2.6% to 2.3 million acres in 2025. Barley area in Manitoba edged down 0.6% to 309,400 acres.
Nationally, oat area rose 3.3% compared with 2024 to 3.0 million acres. Producers may have seeded more oats because of low oat stocks.
In Saskatchewan, oat area rose 1.8% to 1.3 million acres, while farmers in Alberta (+6.4%) and Manitoba (+6.4%) planted more oats.
More corn for grain planted in Ontario and Manitoba
At the national level, farmers reported seeding more corn for grain in 2025, rising 2.2% to 3.7 million acres from the previous year.
In Ontario, where roughly 60% of all corn for grain is grown, farmers reported a 3.1% increase in seeded area to 2.2 million acres.
Quebec farmers reported seeding less corn for grain, dropping 2.8% to 854,600 acres compared with 2024, while seeded area in Manitoba rose 7.6% to 543,200 acres.
More lentils and dry peas planted
In 2025, Canadian farmers reported planting 4.4 million acres of lentils, up 4.0% from a year earlier and above the five-year average area. Producers in Saskatchewan, where the majority of Canada's lentils are grown, reported seeding 3.8 million acres of lentils in 2025, up 4.4% from one year earlier. In Alberta, farmers reported planting 565,200 acres, up 1.0%.
Nationally, farmers reported seeding 9.1% more area with dry peas compared with 2024, rising to 3.5 million acres. Dry pea area in Saskatchewan increased 2.2% to 1.8 million acres, while Alberta's area rose 20.5% to 1.5 million acres.
Did you know we have a mobile app?
Download our mobile app and get timely access to data at your fingertips! The StatsCAN app is available for free on the App Store and on Google Play.
Upcoming changes to the Statistics Canada homepage
On July 16, Statistics Canada will launch an improved homepage to facilitate navigation and data access. Rest assured that the new design will not affect your bookmarks or access to The Daily, data tables, web scraping, or other key functionalities.
For more information, please visit the page on the upcoming changes to the Statistics Canada website.
Note to readers
The June 2025 Field Crop Survey, which collects information on field crop seeded areas in Canada, was conducted from May 15 to June 12, 2025, and included approximately 25,000 farms. Respondents were asked to report their seeded areas of grain, oilseeds and special crops.
June seeded acres are subject to updates from subsequent surveys during the current crop year. Data on final acreages for 2025 will be released on December 4, 2025, and will be subject to revision for two years.
Statistics Canada has made preliminary revisions to historical canola production and stocks estimates ahead of the usual revision cycle. These preliminary revisions are part of continued efforts to monitor the situation and ensure timely, high-quality data. Associated revisions to national supply-disposition tables for major crops are available in data tables 32-10-0013-01 and 32-10-0015-01.
Field crop surveys collect data from Quebec, Ontario, Manitoba, Saskatchewan and Alberta at all survey cycles. However, they collect data twice a year (in the June iteration of the field crop survey on seeded areas and in the November iteration of the field crop survey on final production) from Newfoundland and Labrador, Prince Edward Island, Nova Scotia, New Brunswick and British Columbia, which represent from 2% to 4% of national totals. Therefore, Canadian totals for spring seeding intentions include carry-over data for these provinces from their preceding November survey, and Canadian totals for July include carry-over data for these same provinces from their preceding June survey.
Release calendar: The dates for upcoming releases of stocks, areas and production of principal field crops are available online.
In this release, percentage changes are calculated using unrounded data.
Data for 2025 are compared with final 2024 data.
For more information on agriculture and food, visit the Agriculture and food statistics portal.
An easy-to-print chart, Crop Report Survey at a Glance, which provides an overview of Statistics Canada's survey cycle, is now available.